Reports
Reports: what each one shows
Reports turn your transactions into answers: where the money went, how this year compares with last, whether you stuck to the plan. They're calculated in your browser from your own data.
Where to find it: Reports
The reports
Income & spending compares money in and out month by month. Categories and Merchants show where it went, as bars, a donut or a treemap. Cash flow shows what each month added or took away. Net worth follows what you own minus what you owe. Accounts shows each account's balance over time.
Budget vs actual compares your plan with what happened. Paychecks breaks down your pay. Yearly sums up a whole year. A business space also has a Business report.
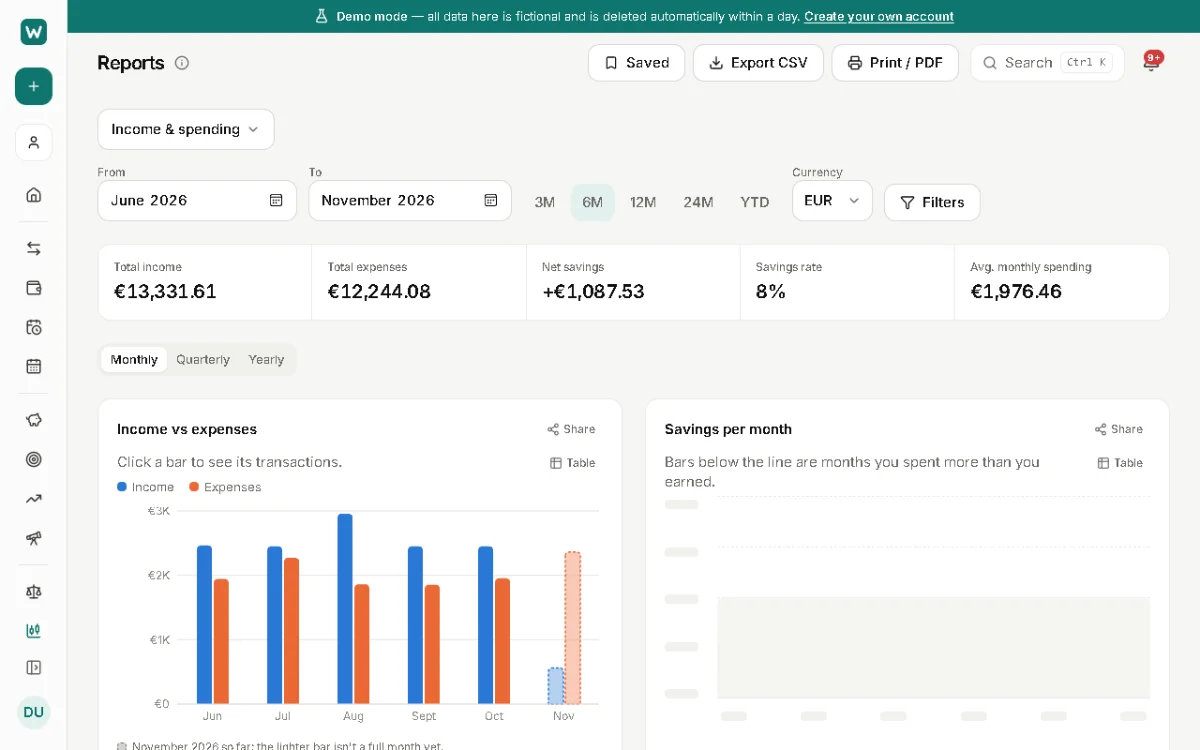
Choosing what to see
Pick the period (6, 12 or 24 months, or your own dates) and filter by account, category, merchant or tag. Export CSV downloads the transactions behind the report.
Save a view you use often as a saved report, with its filters, and open it again in one step.
Also in Insights
Weekly recap is a week at a glance: where the money went, this month's plan, the largest expenses, goals and the bills due in the next 7 days. Tax sums up the year's tax-relevant categories.
Updated 21 November 2026